
Alphabet xStock (GOOGLx) is performing with bullish momentum despite the broader crypto market seeing a downturn amid uncertainty. GOOGLx token price rose 1.76% over the previous day and 7.65% in the month, reflecting investors ‘ interest in the market.

Alphabet xStock market volume climbed 147.24%, indicating short-term bullish momentum in the market. GOOGLx, at the time of writing, is trading $208.13, seeing the next target at $240. Its total market cap, as per CoinMarketCap, reached $1.24 million, adding 1.02% over the past 24 hours.
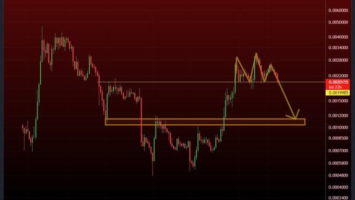
Alphabet $GOOG is Breaking Out, Targeting $240!
A prominent analyst, Ali, prediction on Alphabet xStock. He added that the stock has moved above a strong resistance level (around $205–210). This signals buyers are gaining control, and the stock could enter a new upward trend.

Ali also said based on past price levels (resistance zones), chart patterns, and momentum, the next logical upside target is around $240. That’s where traders expect the stock to face the next major selling pressure.
According to the market sentiment and volume, $GOOG is in the bullish zone. This breakout confirms that the price could touch $240 resistance line. However, major traders and investors keep an eye on the next resistance line.
Overbought Technicals (Mixed Impact)
GOOGLX’s recent price action shows a classic case of strong momentum with early signs of exhaustion. The 7-day RSI at 73.18 puts the stock firmly in overbought territory, suggesting that buyers have been aggressive in the short term. Meanwhile, trading above the 30-day SMA ($199.14) confirms that the broader trend remains bullish, with price still supported by medium-term moving averages.
However, the negative turn in the MACD histogram (-0.0855) is a caution flag. While momentum remains positive overall, the slight dip signals that bullish strength may be fading, opening the door for a pullback if profit-taking kicks in.
Furthermore, $201.45 is immediate Fibonacci support, and $210.35 is resistance. If the stock holds above $208 and breaks past $210, it could continue its uptrend toward higher levels. But a failure to defend that $208 zone would likely confirm short-term weakness and possibly drag the price back toward the $195–$197 range.
Related Reading | Chainlink Eyes $30 Amid ICE Integration, Whale Accumulation, & Derivatives Momentum

 Breaks Resistance: Eyes On $240)
 Breaks Resistance: Eyes On $240)
Comments (No)