

The cryptocurrency market is currently turbulent due to Mt. Gox BTC liquidation. However, Dogecoin (DOGE) has emerged as a stable performer, gaining 11% weekly amidst market volatility. It remains strong at $0.1188, showing a 4.65% increase in the last 24 hours, unaffected by recent declines in Bitcoin.
Recent analysis by World of Charts suggests a promising bullish trend for Dogecoin. Analysts point to a breakout from a prolonged downward channel, indicating the potential for the cryptocurrency’s value to double in the coming days.
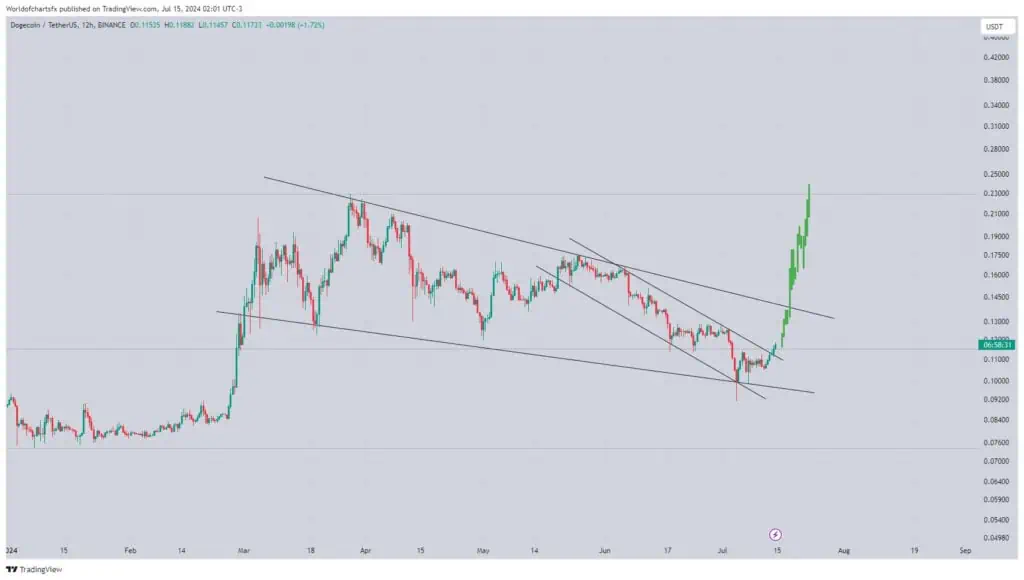
For several months, Dogecoin was stuck in a downward channel, marked by declining highs and lows, signaling a bearish trend. However, recent developments have seen a clear breakthrough above this descending resistance line, a strong bullish signal. The breakout is evident in the form of tall green candlesticks, indicating a surge in buying pressure.
Historically, such breakouts often precede significant price movements. Analysts at World of Charts foresee a doubling in Dogecoin’s price, driven by the momentum unleashed by this breakout. The decisive move above the upper boundary of the channel, coupled with sustained upward momentum, solidifies this breakout.
Could Dogecoin Price Double Soon? Experts Weigh In
The breakout initially occurred around $0.114, quickly pushing the price up to about $0.119. This rapid increase indicates strong bullish sentiment, suggesting traders have confidence in Dogecoin’s potential for further gains. Analysts forecasting a potential 2x increase imply Dogecoin could reach approximately $0.238 if bullish momentum persists.
Furthermore, both the 50-day EMA at $0.1273 and the 100-day EMA at $0.1345 are currently above the current price, acting as immediate resistance levels. This positioning suggests potential challenges for Dogecoin to surpass these levels in the near term.
Moreover, the 50-day EMA being below the 100-day EMA reinforces a bearish trend, indicating stronger longer-term momentum compared to the shorter term.
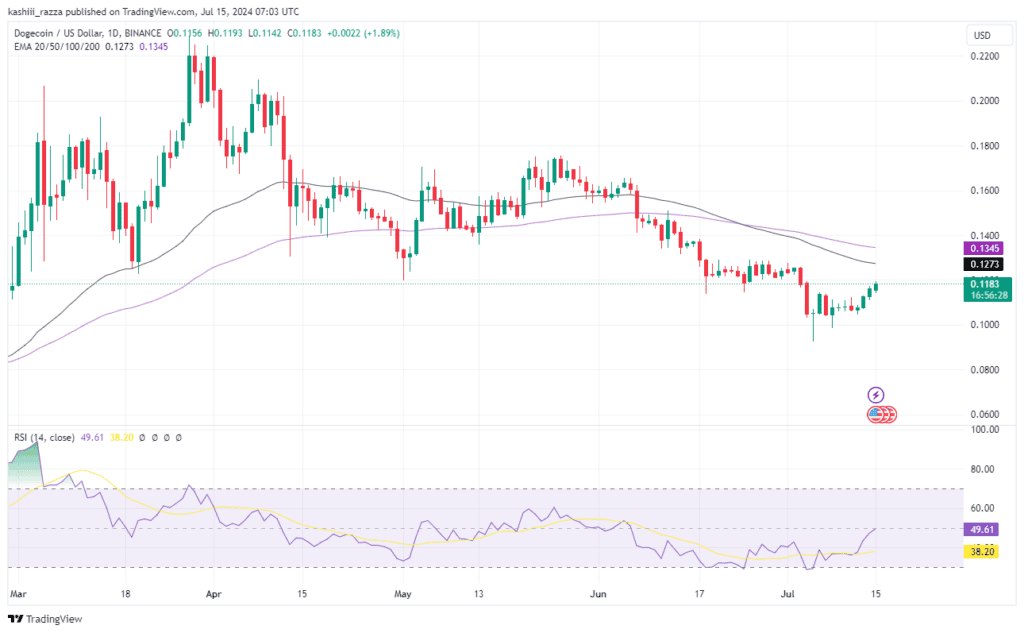
The Relative Strength Index (RSI) stands at 49.61, close to the neutral 50 mark, indicating balanced but slightly bearish momentum. The recent upward movement from below 38.20 suggests a mild recovery or potential reversal. However, the RSI not yet crossing above 50 suggests buying pressure may not be strong enough to signal a significant bullish trend.
The MACD indicator shows the MACD line slightly above the signal line, indicating a potential bullish signal as it enters positive territory. Additionally, the histogram is beginning to display green bars, supporting the possibility of building bullish momentum.
Related Reading | Analyzing BlackRock $1 Billion DeFi Gamble: Is This The Future Of Institutional Crypto?
Furthermore, the author’s views are for reference only and shall not constitute investment advice. Before purchasing, please ensure you fully understand and assess the products and associated risks.


Comments (No)